

One question
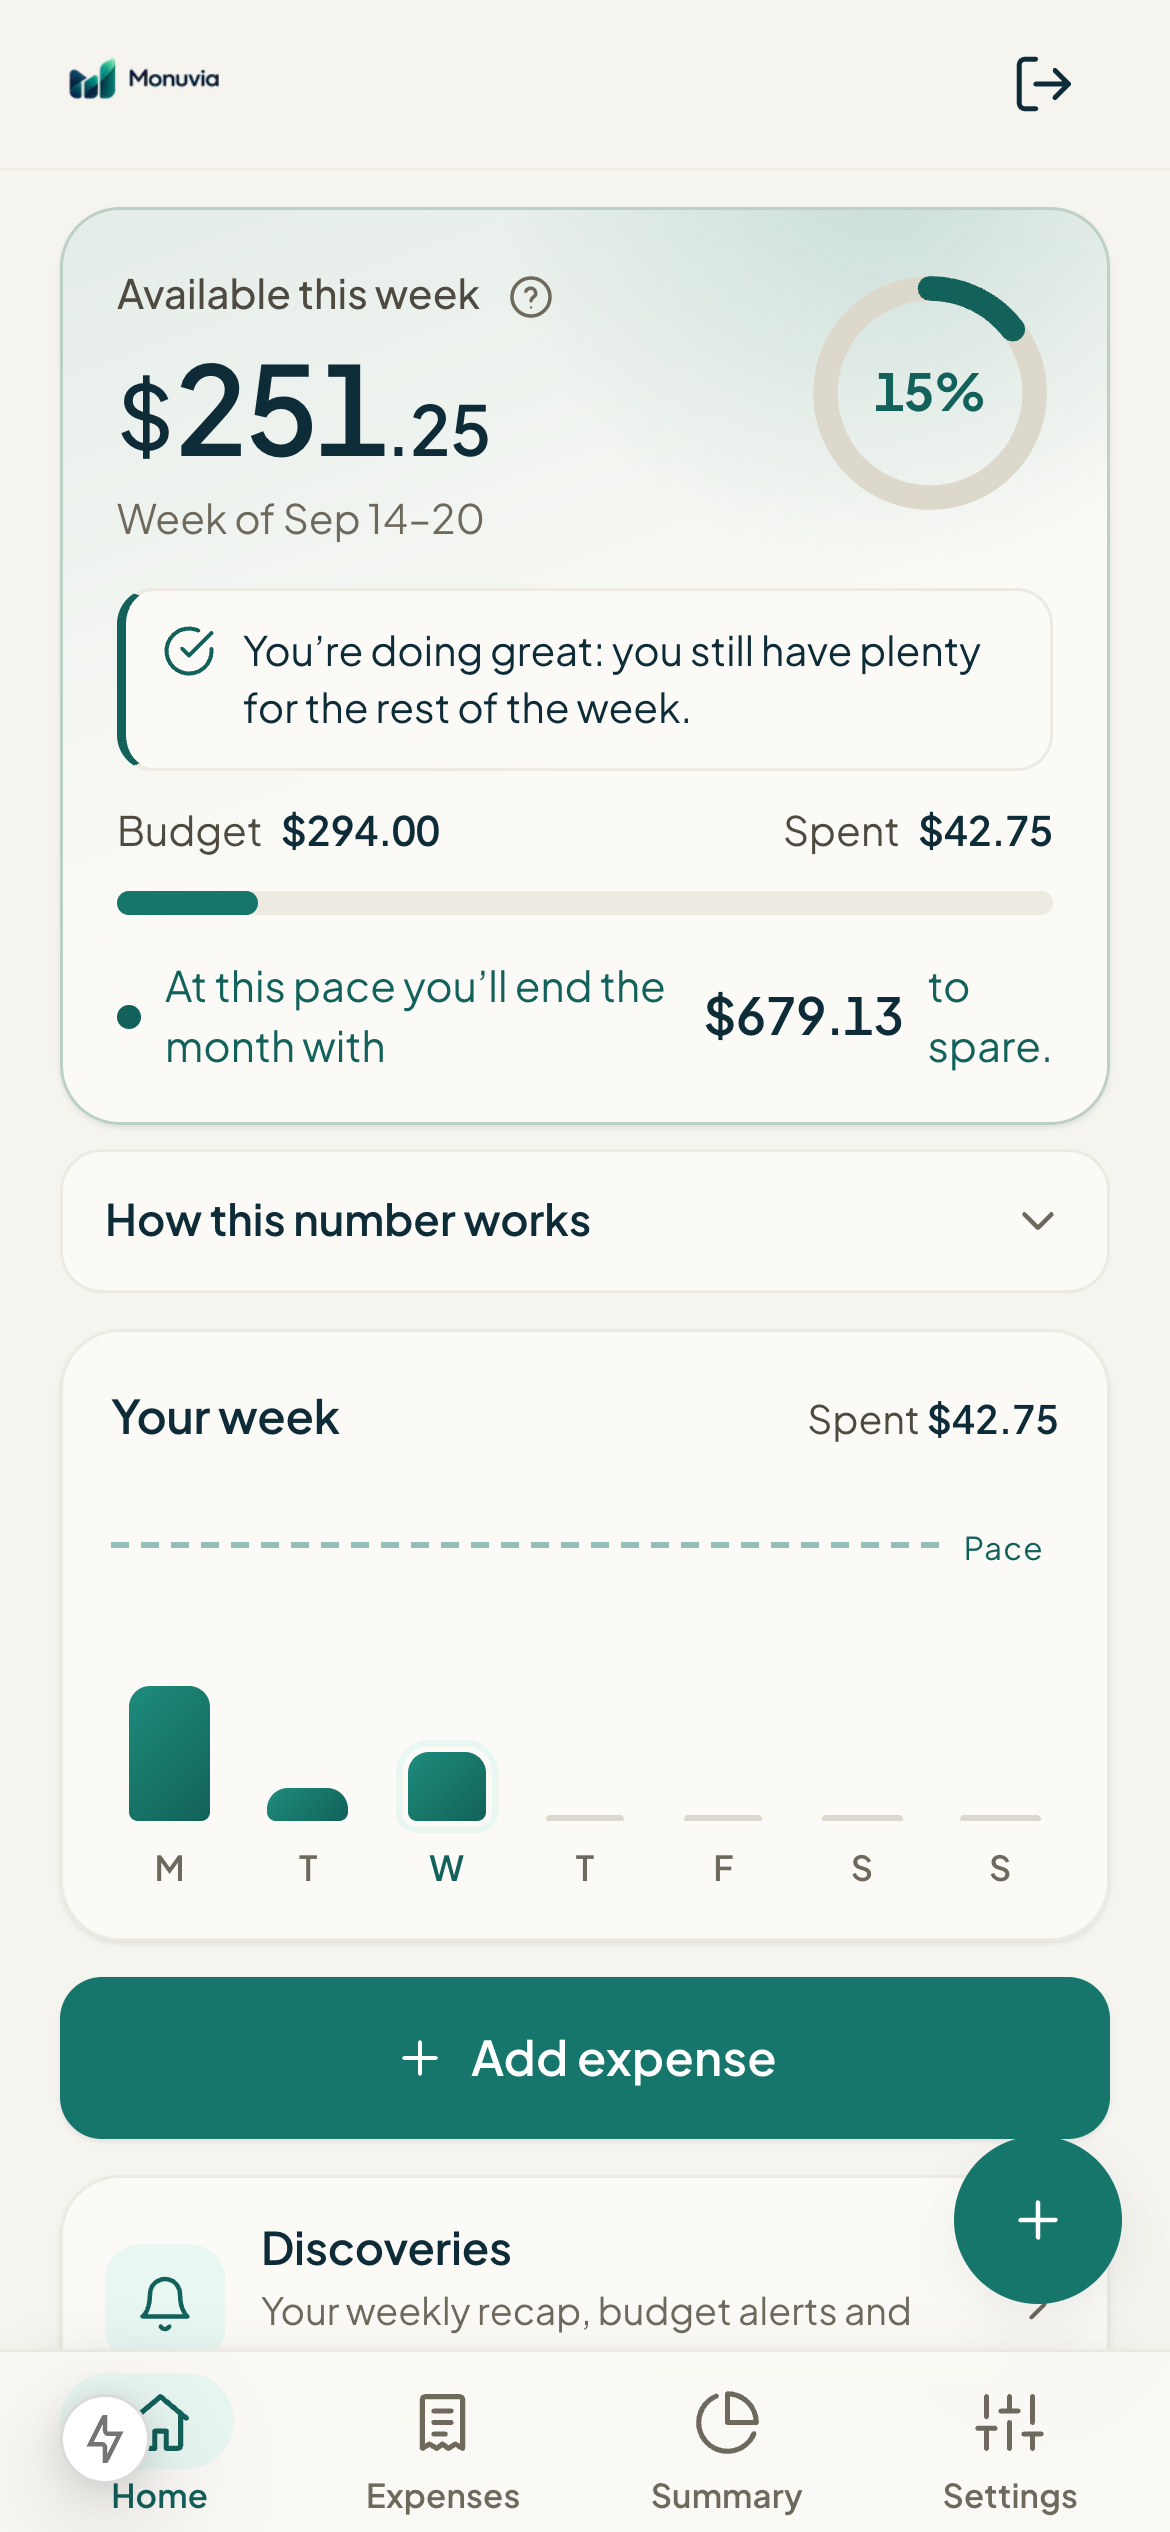
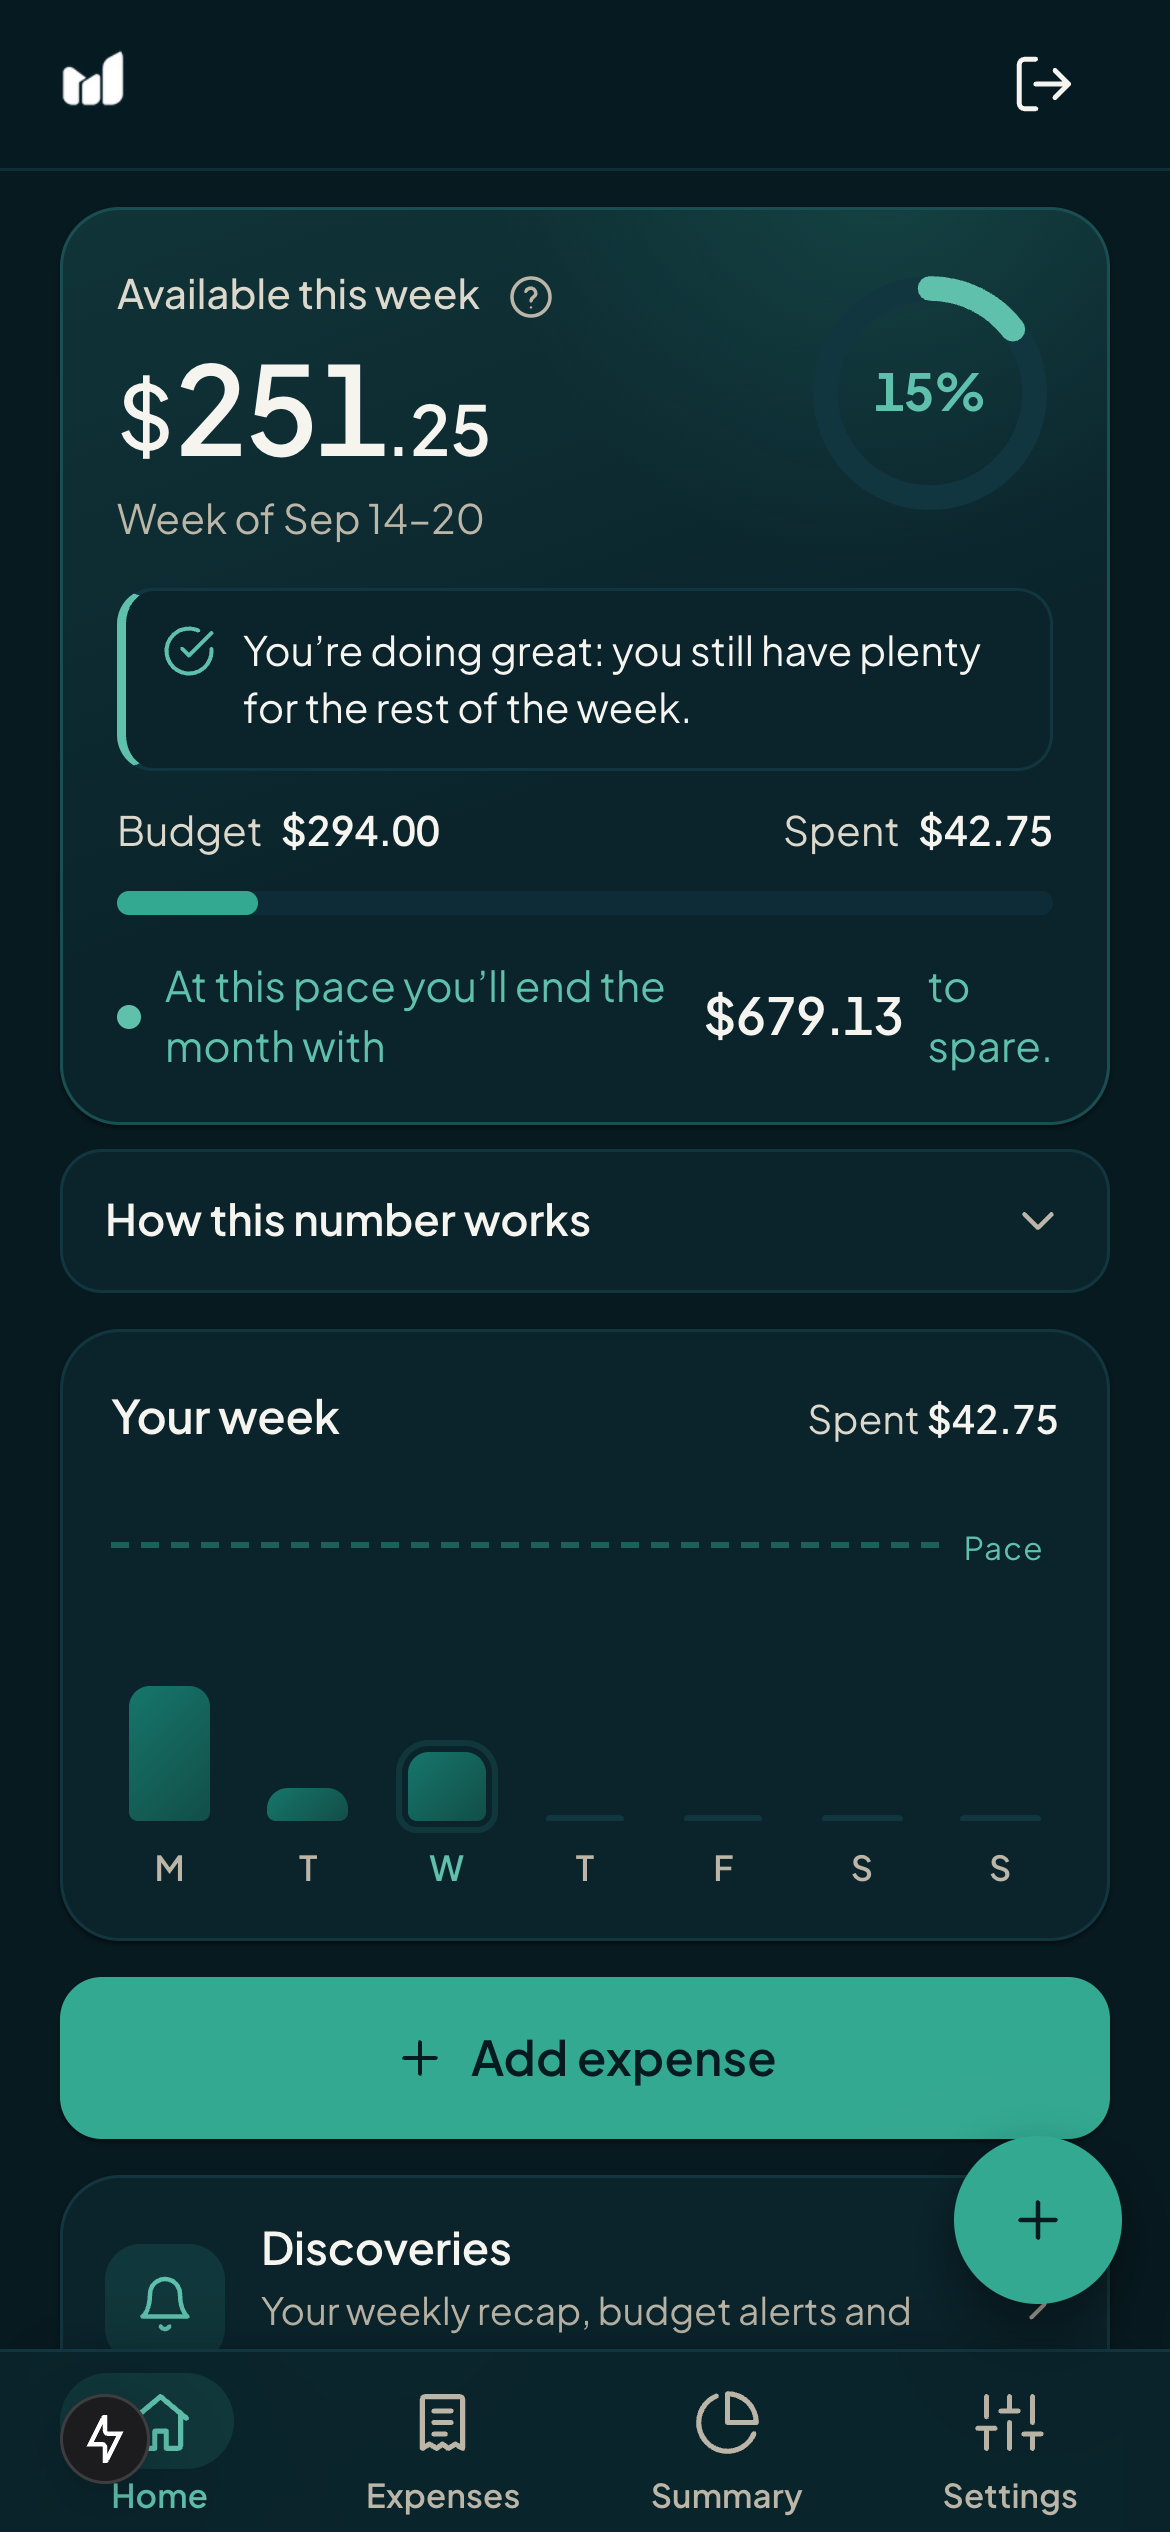
“How much can I spend this week?” Front and center when you open it. With the breakdown of how this number is calculated.
Monuvia shows what you can really spend today: your money minus what you already owe and what you set aside for your goals. Not your bank balance — one honest number.
Available this week
$180.00
of $180.00 · spent $0.00
Demo with sample data
Monuvia sets aside your bills and your savings goal, then spreads what is left across the weeks. Move the values and see the full math, with the same formula the app uses.
Demo with sample data
Each week's budget is fixed: the free amount is spread across days, not “four ways.” A 3-day week gets 3/30. It only goes down with what you spend; each month starts over.
Just like your phone’s wallet: every payment opens a sheet with the merchant, the amount, the time and a mini-map of the place — so you recognize at a glance what you spent on.
−$24.00
Groceries
Where you paid · Balboa Ave
Illustration with sample data
Currencies supported
Spanish and English
Connections to your bank
Honest number when you open it
“How much can I spend this week?” Front and center when you open it. With the breakdown of how this number is calculated.
Your monthly goal is set aside before the free amount is calculated, so saving does not depend on what is left over.
Add expenses by hand, from a photo of a receipt, or by letting your phone send every contactless payment.
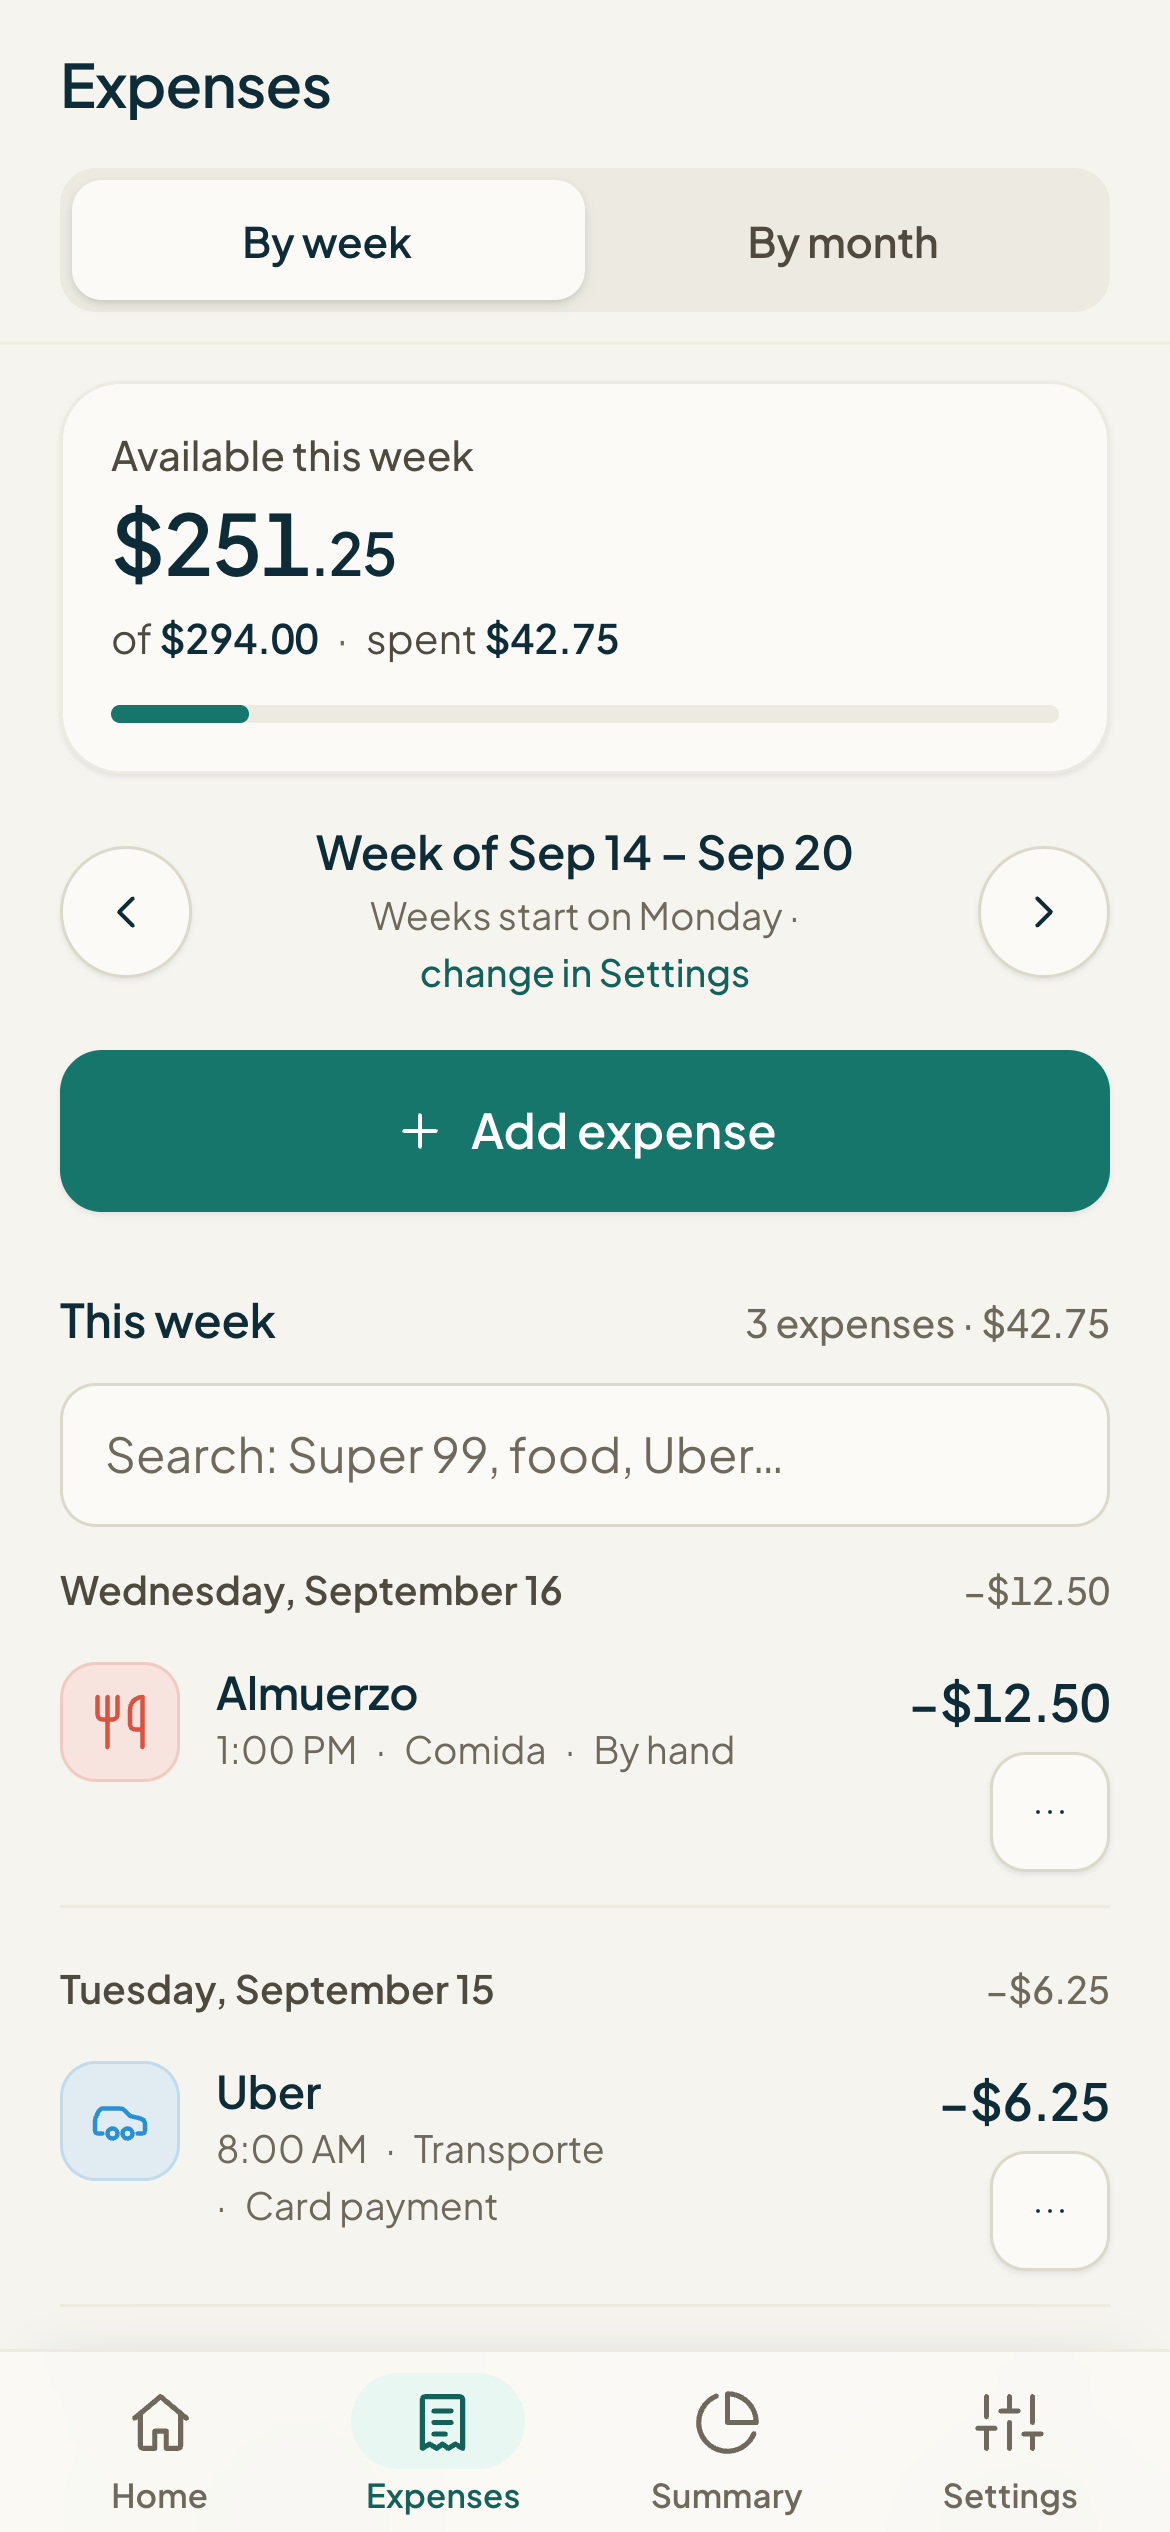
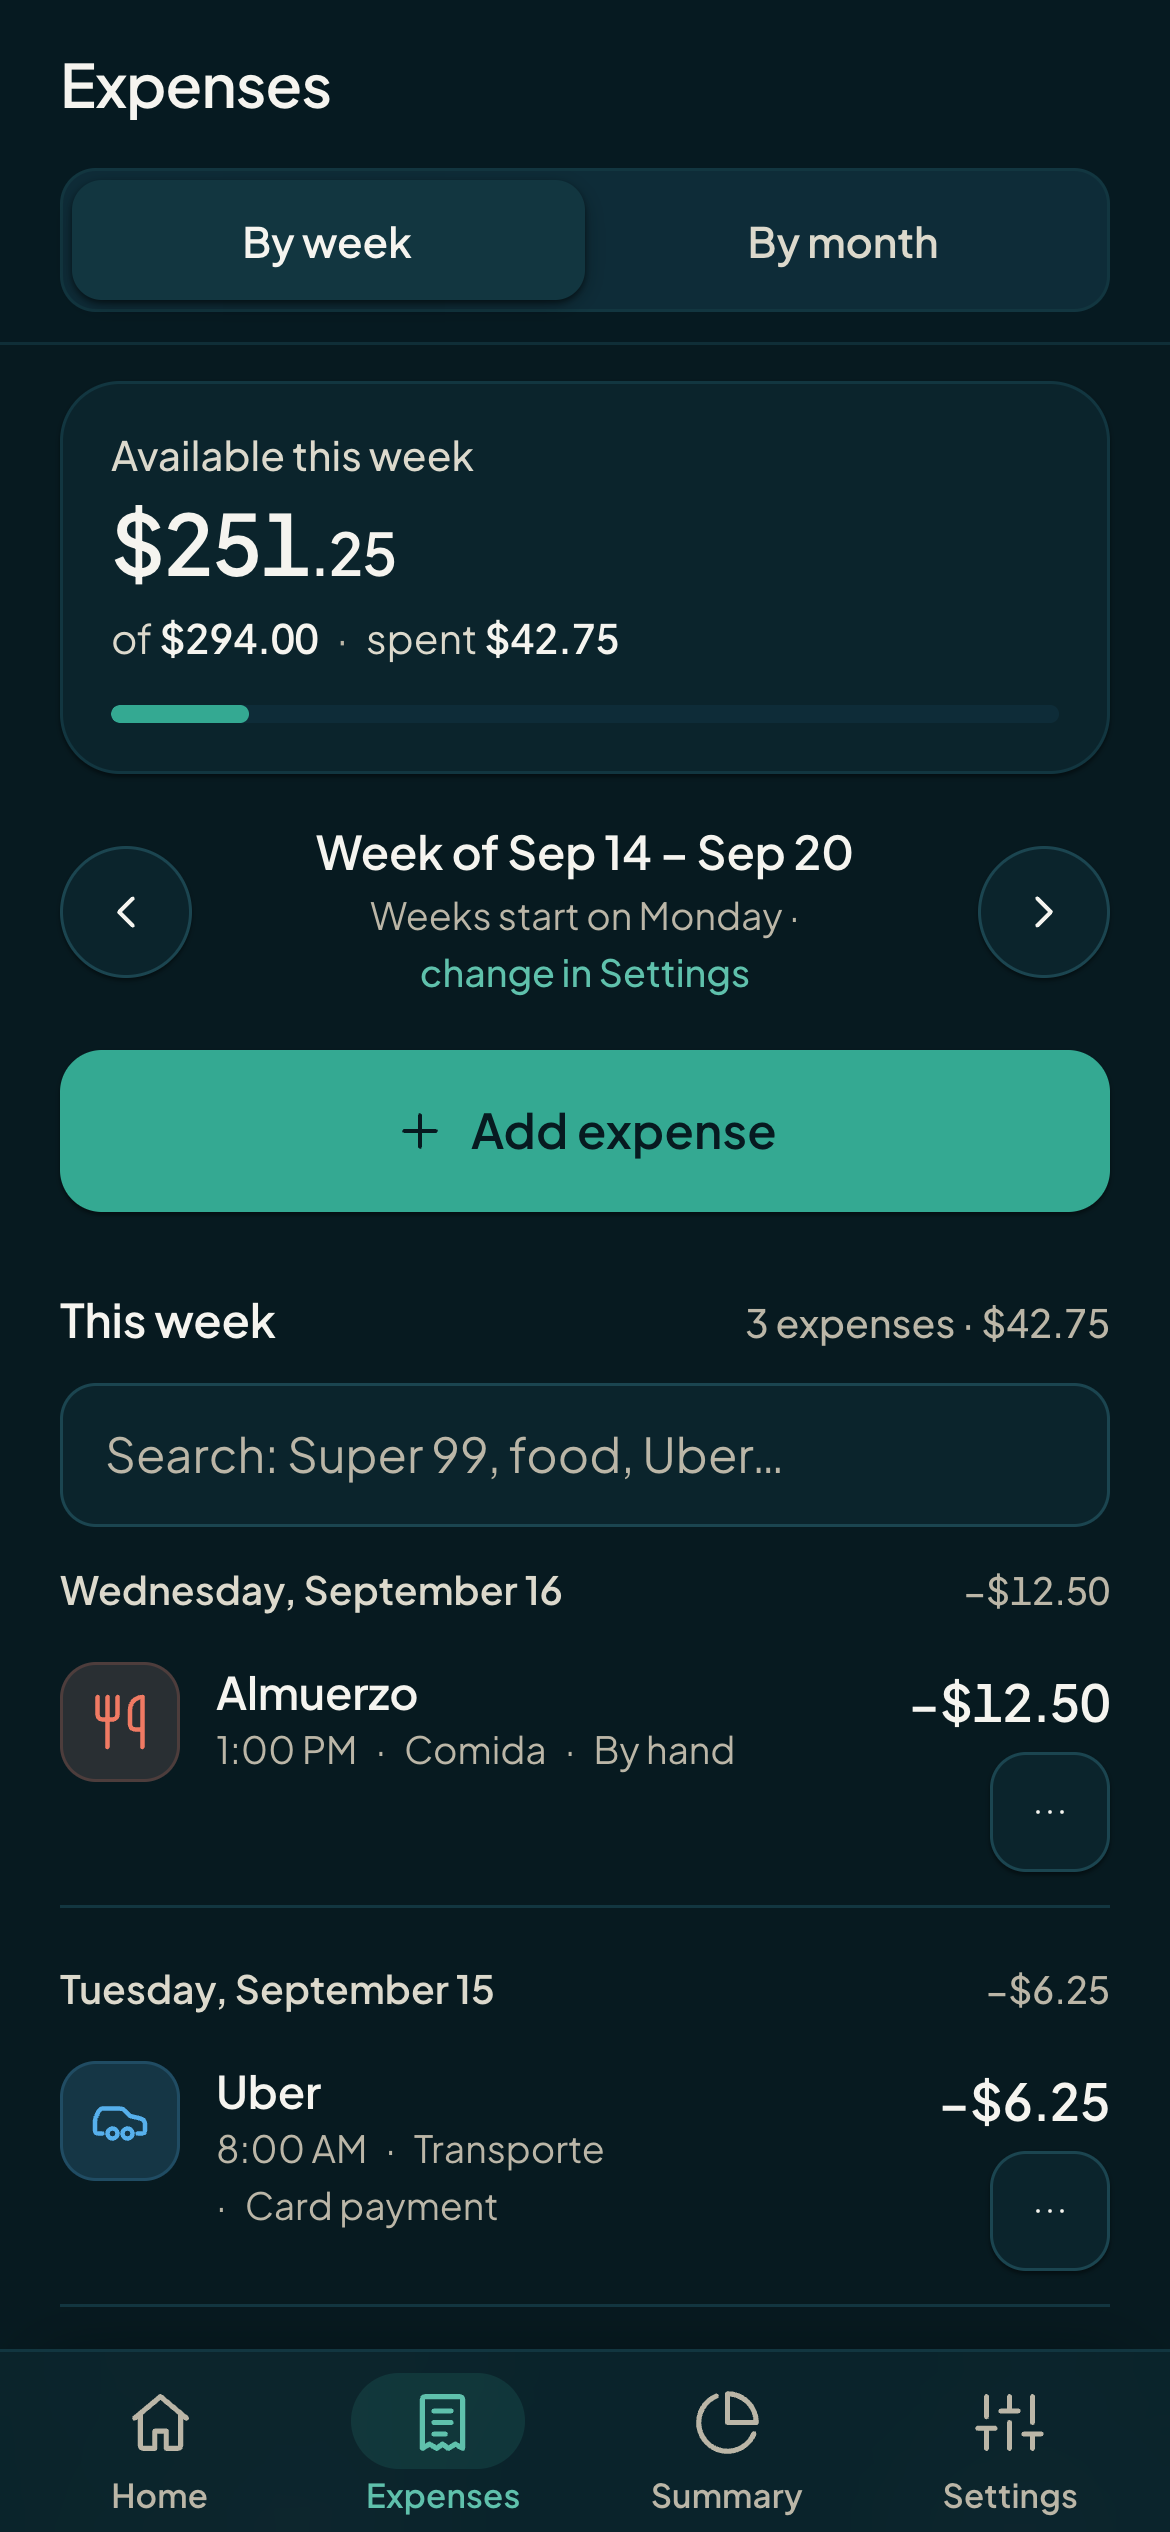
Not mockups — real screenshots of Monuvia. A dashboard that answers one question, your expenses at a glance, and your fixed bills on track.
Real screenshots from the app
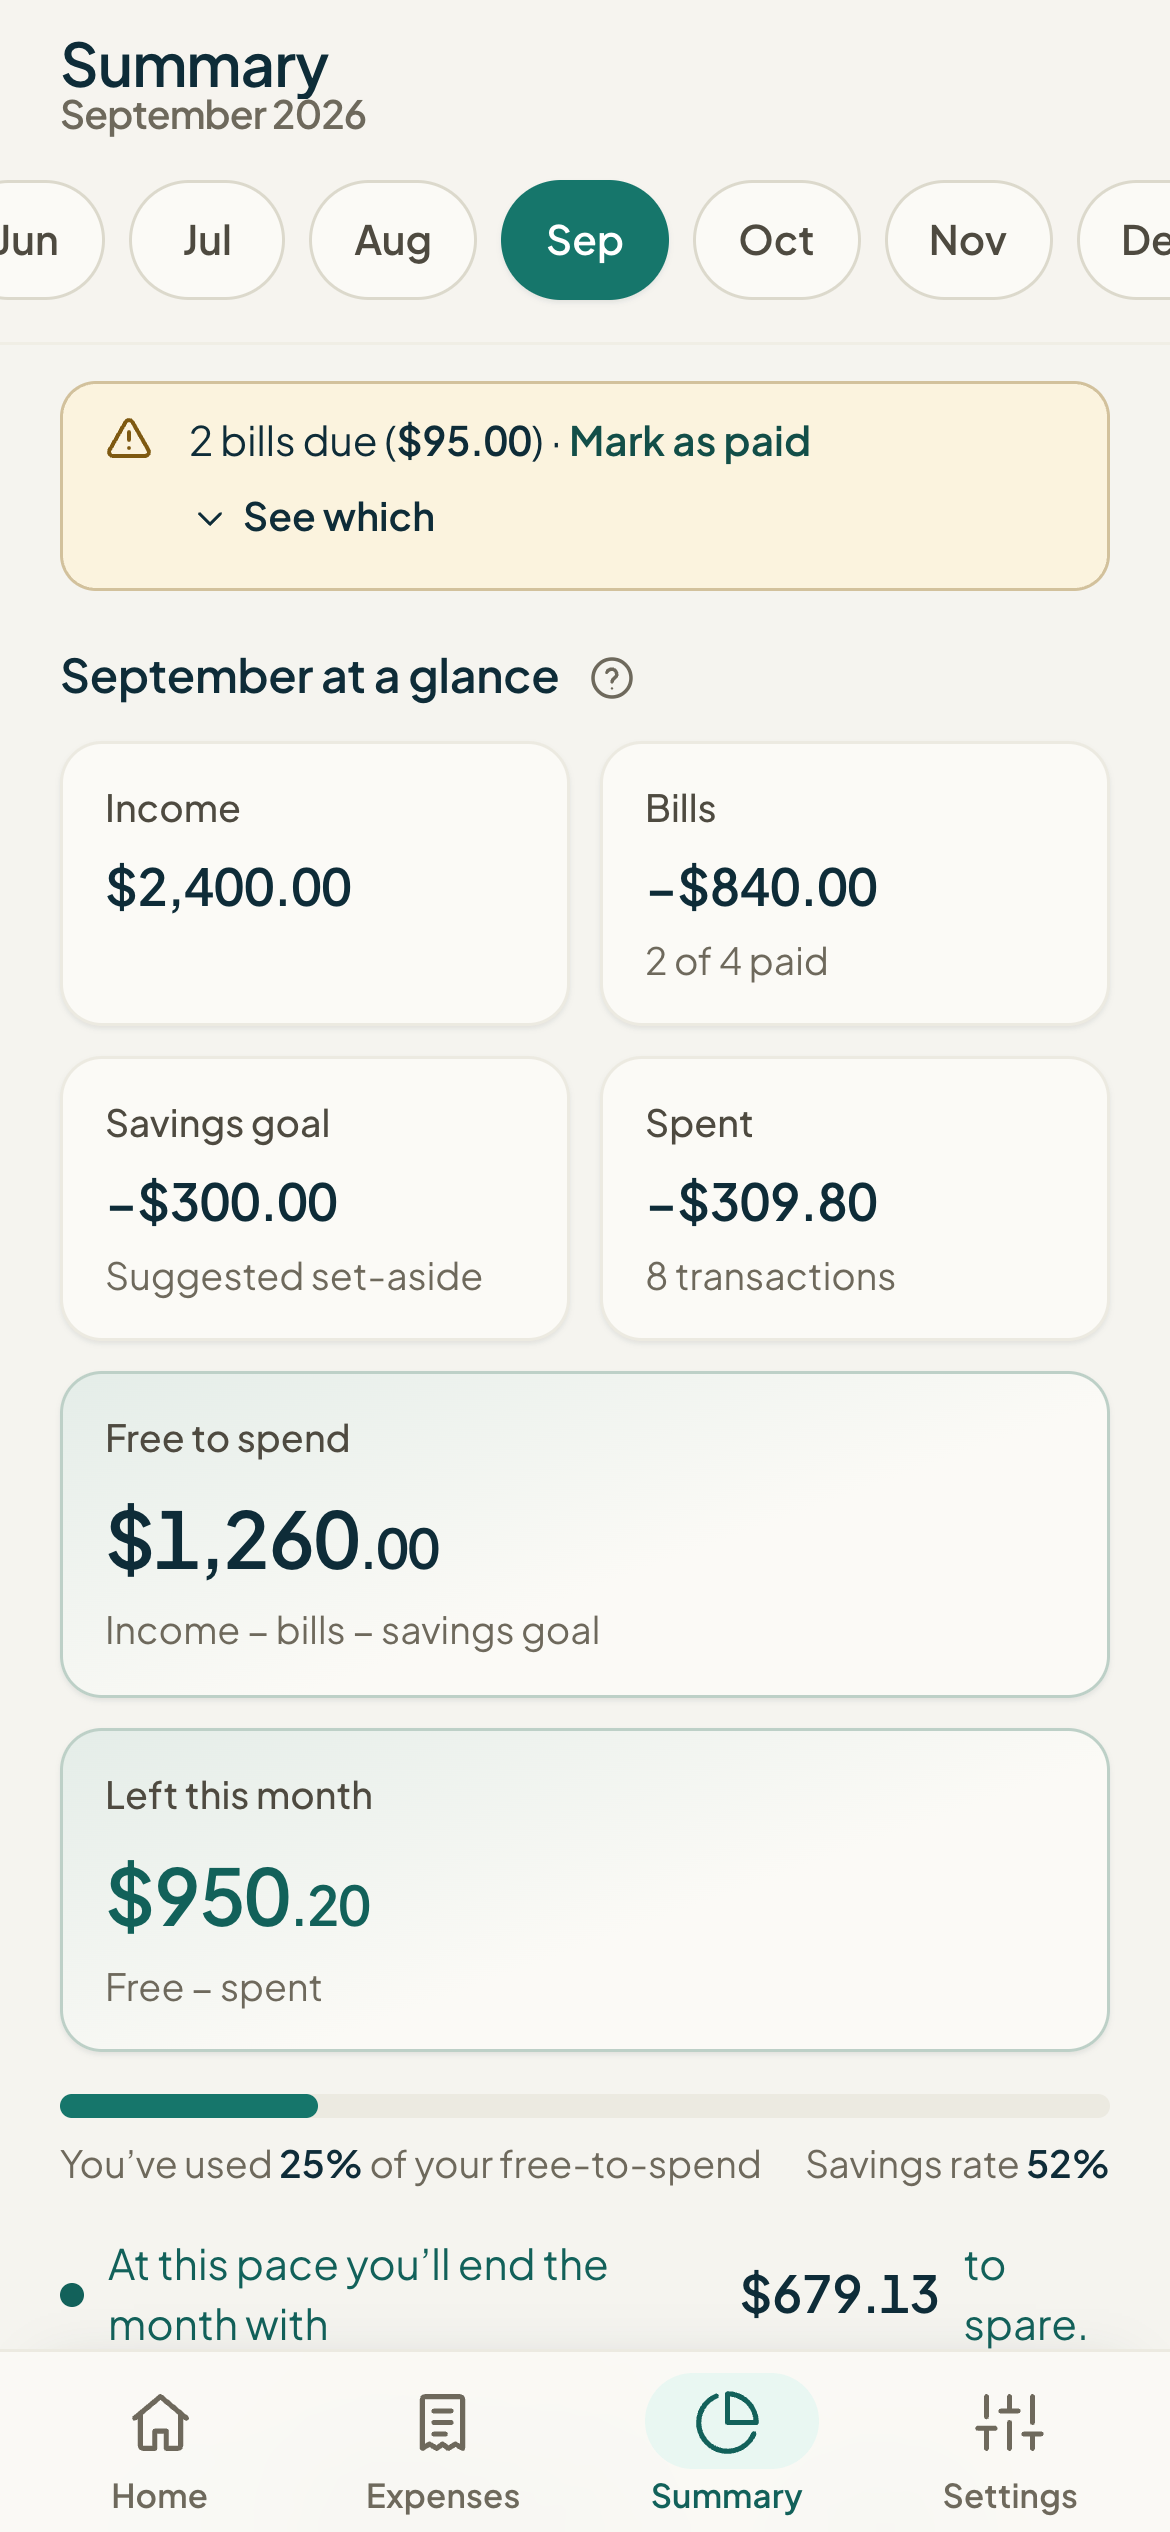
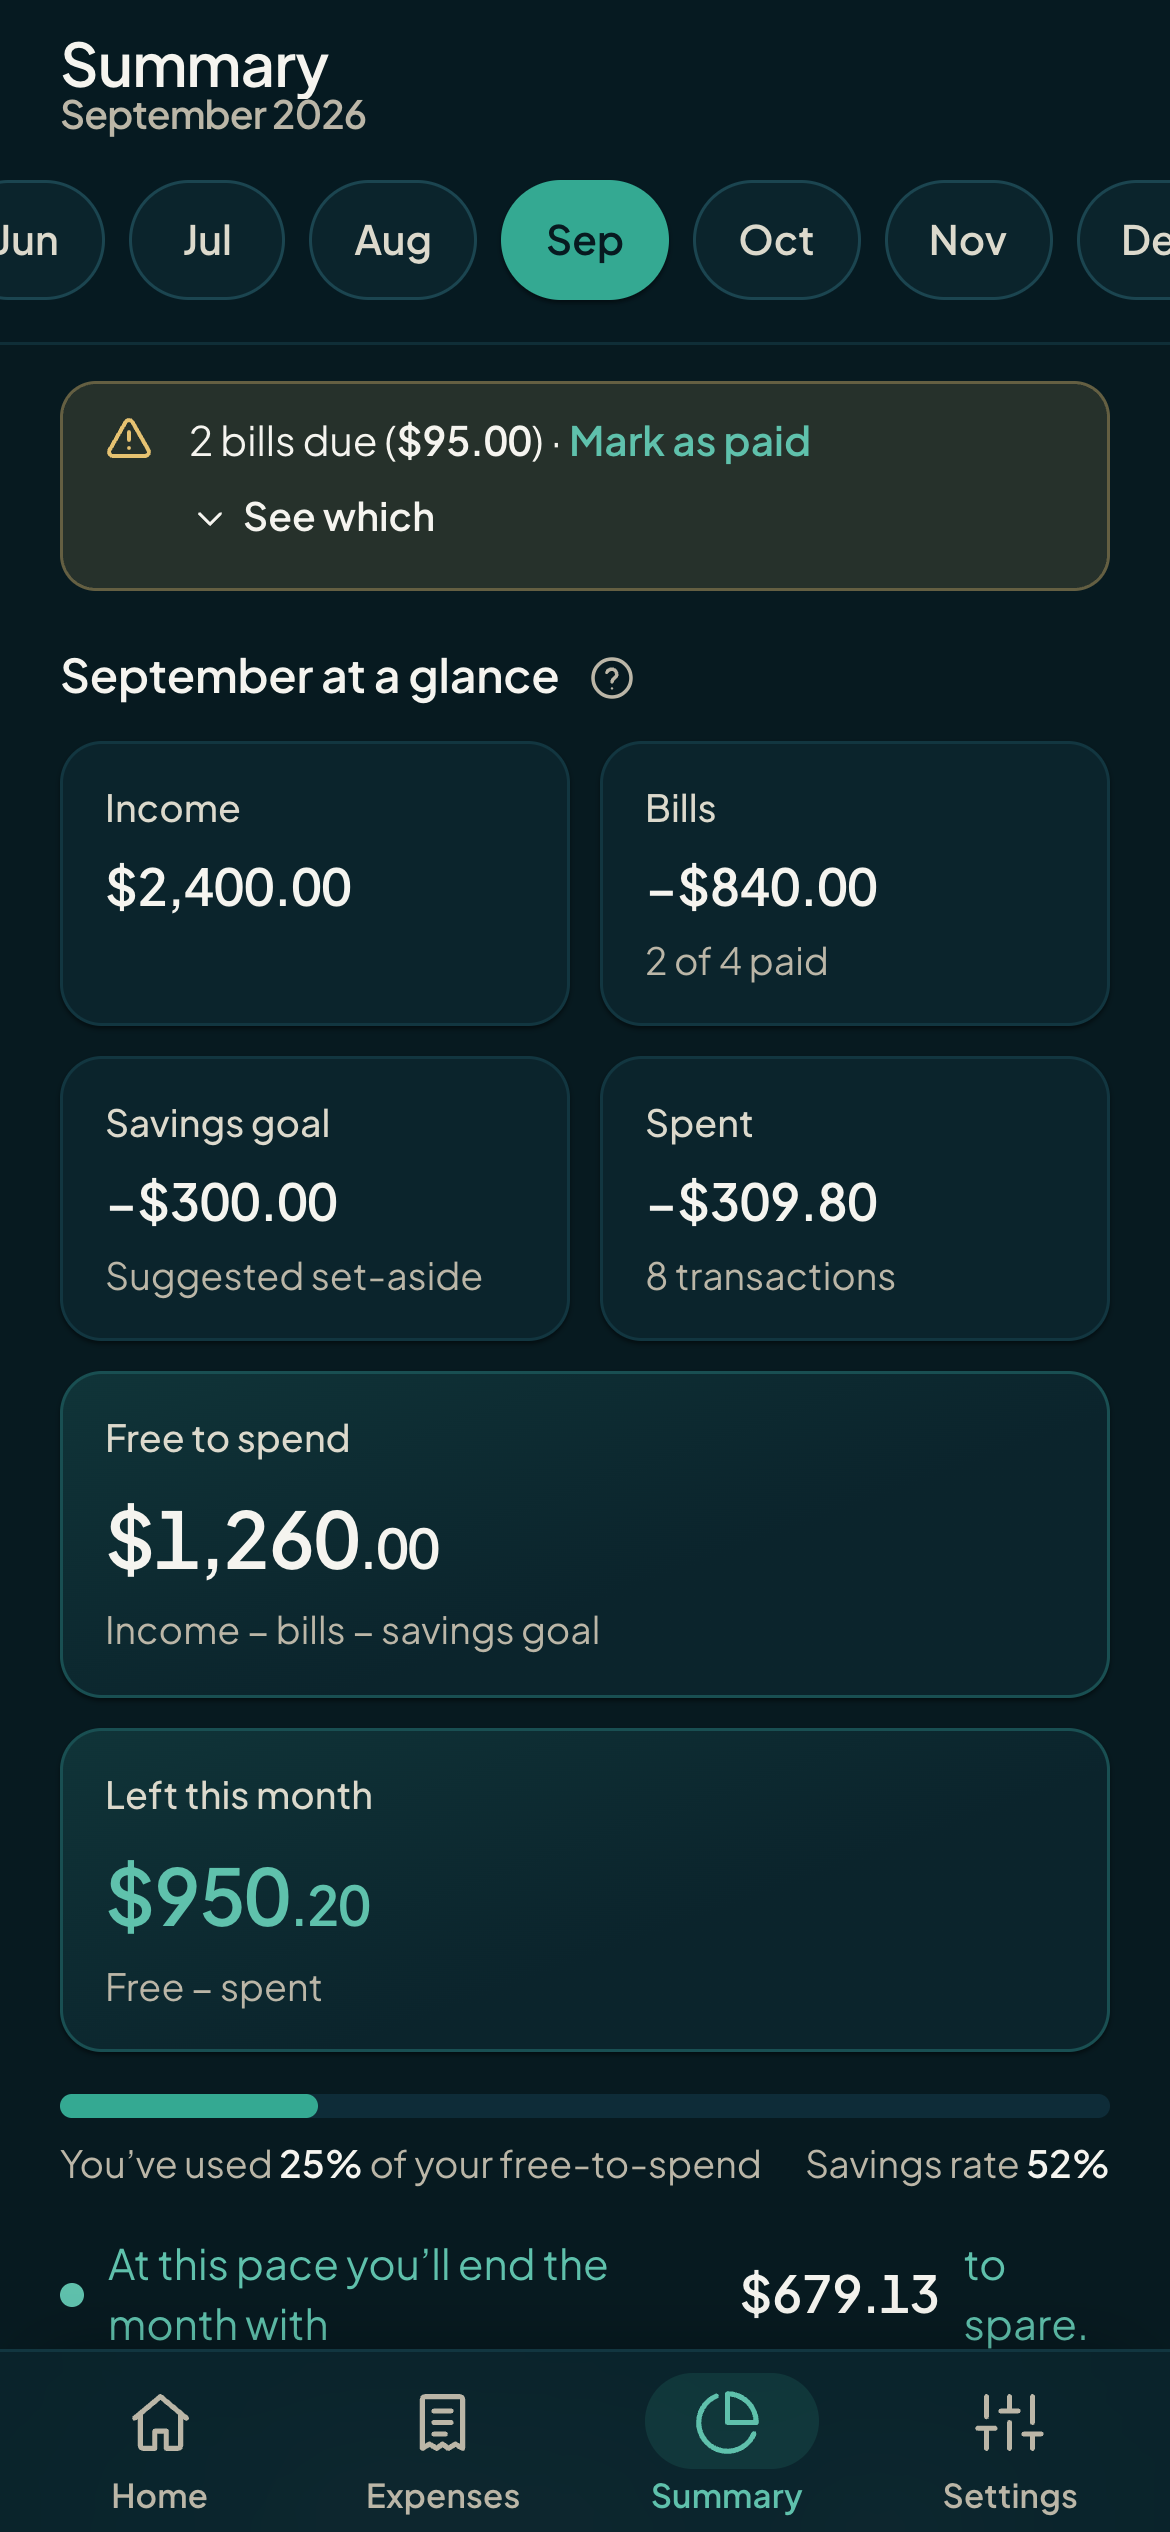
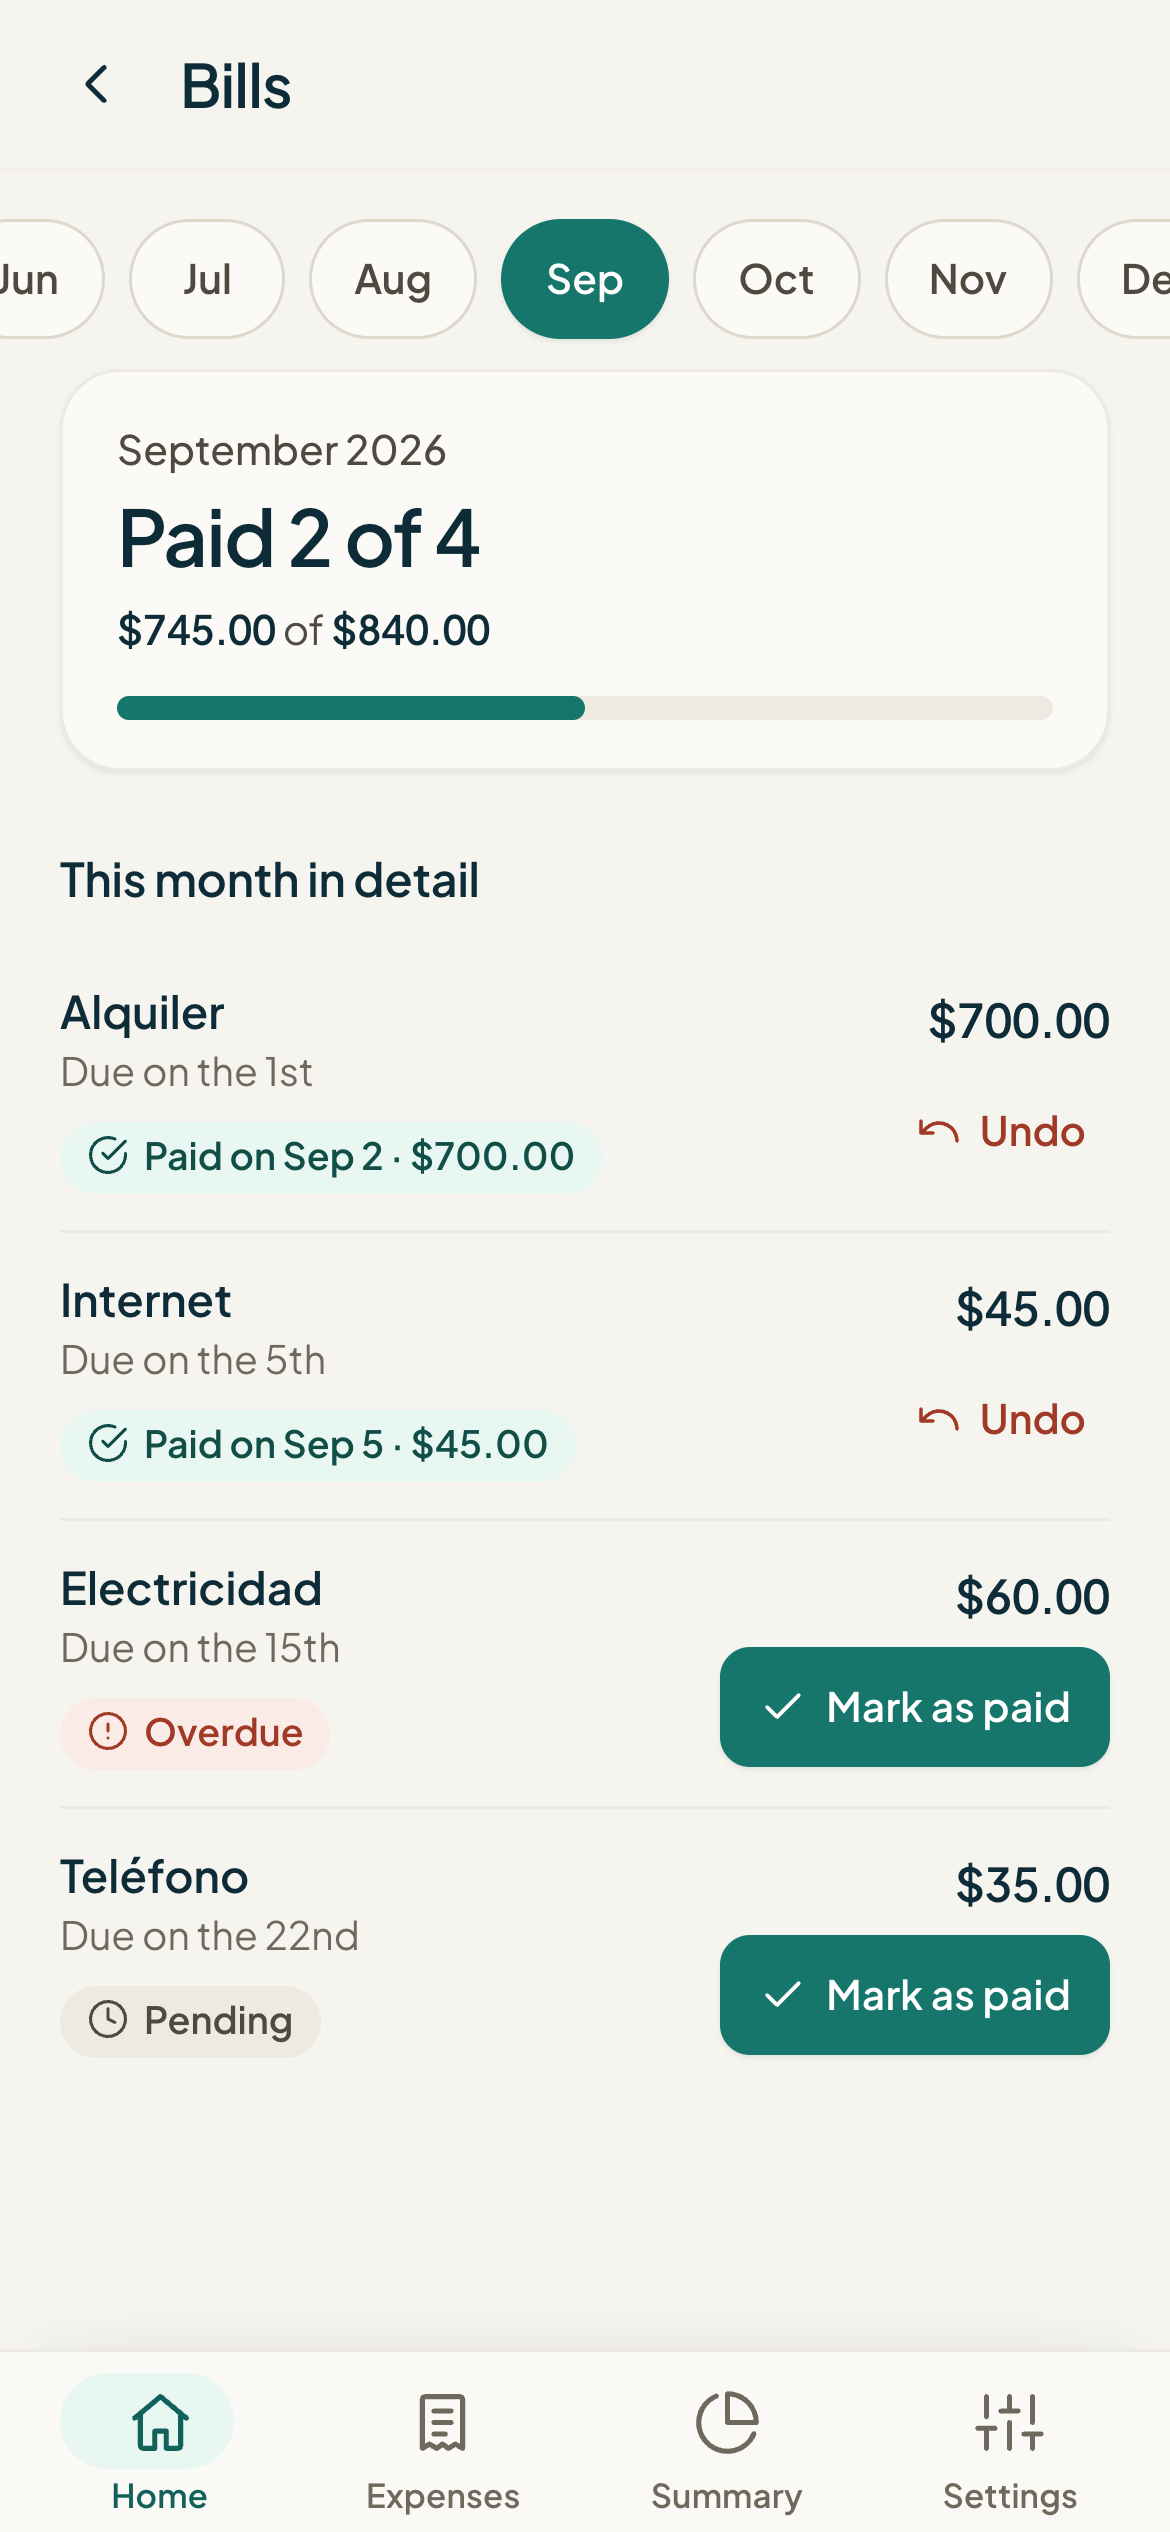
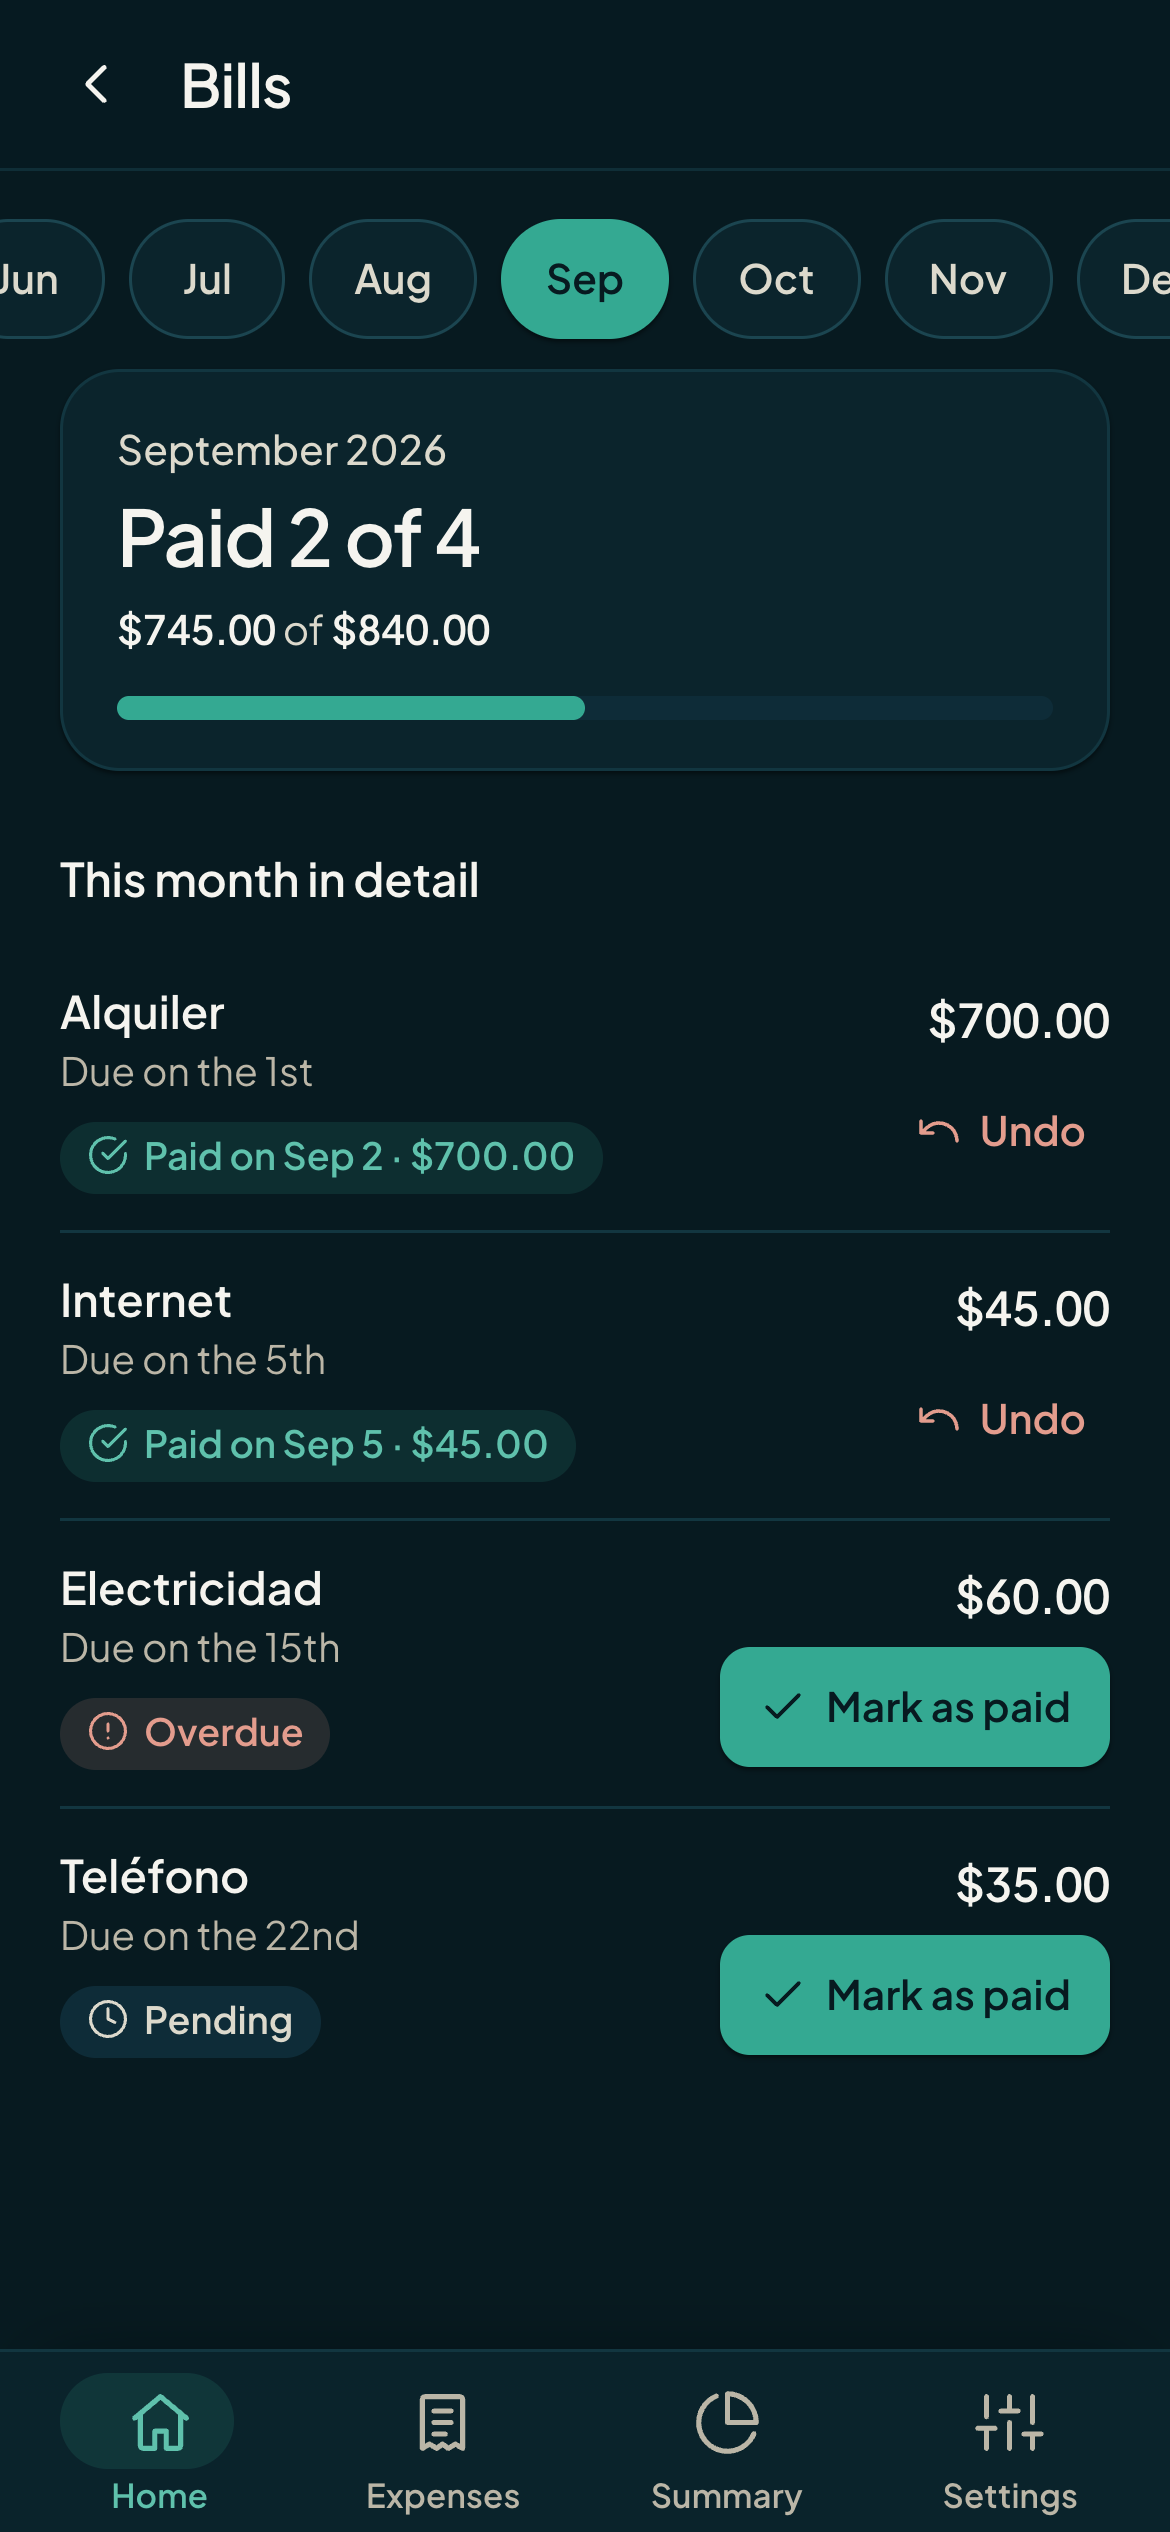
Every feature has its own article in the manual, with steps and real screenshots.
Tap a movement and its wallet-style sheet opens: merchant, amount, time and a mini-map of where it happened.
Read in the manual →Add an expense by hand or from a photo: the receipt total is read on your own phone. Edit it, delete it, or turn an expense into a bill.
Read in the manual →Mark each fixed payment with its real amount and date. If you pay a different amount than planned, the math uses what you paid. With history and undo.
Read in the manual →A donut chart by category, month-by-month navigation, and a yearly table. Income, bills, goal, spent, and the status of your limits.
Read in the manual →The dashboard speaks plainly by how much of your budget is left: plenty, careful, or at the limit — with advice when needed.
Read in the manual →A single month or the whole year, exportable to PDF with Monuvia branding and to Excel with formulas that recalculate when you edit the amounts.
Read in the manual →Invite by code: everyone signs in with their own account and works on the same budget. It also works perfectly on your own.
Read in the manual →Add expenses and take photos with no signal: they queue on your phone and upload when you reopen Monuvia with a connection.
Read in the manual →Monuvia does not use a chatbot and does not send your finances to an outside AI service. What works for you runs on your phone or in your own private database. Here is exactly what each piece does:
When you photograph a receipt, text recognition (OCR, Tesseract.js) runs inside your browser: the image never leaves your phone. Then a few rules pull the total and the merchant from the recognized text.
As you type the merchant, Monuvia proposes a category based on your rules and how you classified before. The calculation happens in your own database; it is not shared with anyone.
On iPhone, an Apple shortcut logs your contactless payments (Apple Pay); on Android, an automation forwards the text of your bank notification. It is your phone that sends the data: Monuvia does not connect to your bank.
If two charges of the same amount show up within about 20 minutes, Monuvia flags it for you to review. It is a match to confirm, never an automatic deletion.
The budget is worked out with a clear formula in your database: income minus bills minus savings, spread across the days. It is a deterministic calculation, not an estimate.
The mini-map uses OpenStreetMap. The location comes from your phone’s GPS when you log a payment (if you enable it) or is inferred from the merchant name; it’s optional and never shared with your bank.
Want the verifiable technical detail? It is in the technology section and in the manual.
Connect your phone once and your contactless payments come in on their own, with Available this week kept up to date. Each device uses its own token, which you can revoke whenever you want.
Monuvia notification
Expense logged
Super 99 · $24.00 · with Apple Pay
Illustrative example of the real message
Demo with sample data
A donut chart by category shows you at a glance where your money is. Move month by month, check the yearly table, and keep an eye on your category limits.
Tap each category to see its amount and its percentage. It is the same chart, keyboard-accessible, that you will see inside the app.
Monuvia is an installable web app: it opens from its own icon, full screen, with no app store in between.
Share → “Add to Home Screen.”
Browser menu → “Install app…” or “Add to Home screen.”
In Chrome or Edge, the install icon in the address bar.
Safari: File → “Add to Dock.” Chrome: the install icon.
Create your account, add your income and bills, and find out how much you can spend today with peace of mind.