

Understanding your available amount and monthly summary
What your available amount really means (a calculated figure, not a bank balance), how to read the "How this number is calculated" breakdown, why it changes, and how to make sense of the Summary's donut chart and yearly table.
Understand where the big number on your Home screen comes from, why it goes up or down, and how to read the monthly and yearly Summary without mistaking real figures for a projection.
- Income entered in Settings (if it's zero, your budget comes out to zero)
- A connection to calculate an up-to-date available amount (offline, you'll see the last saved figures)
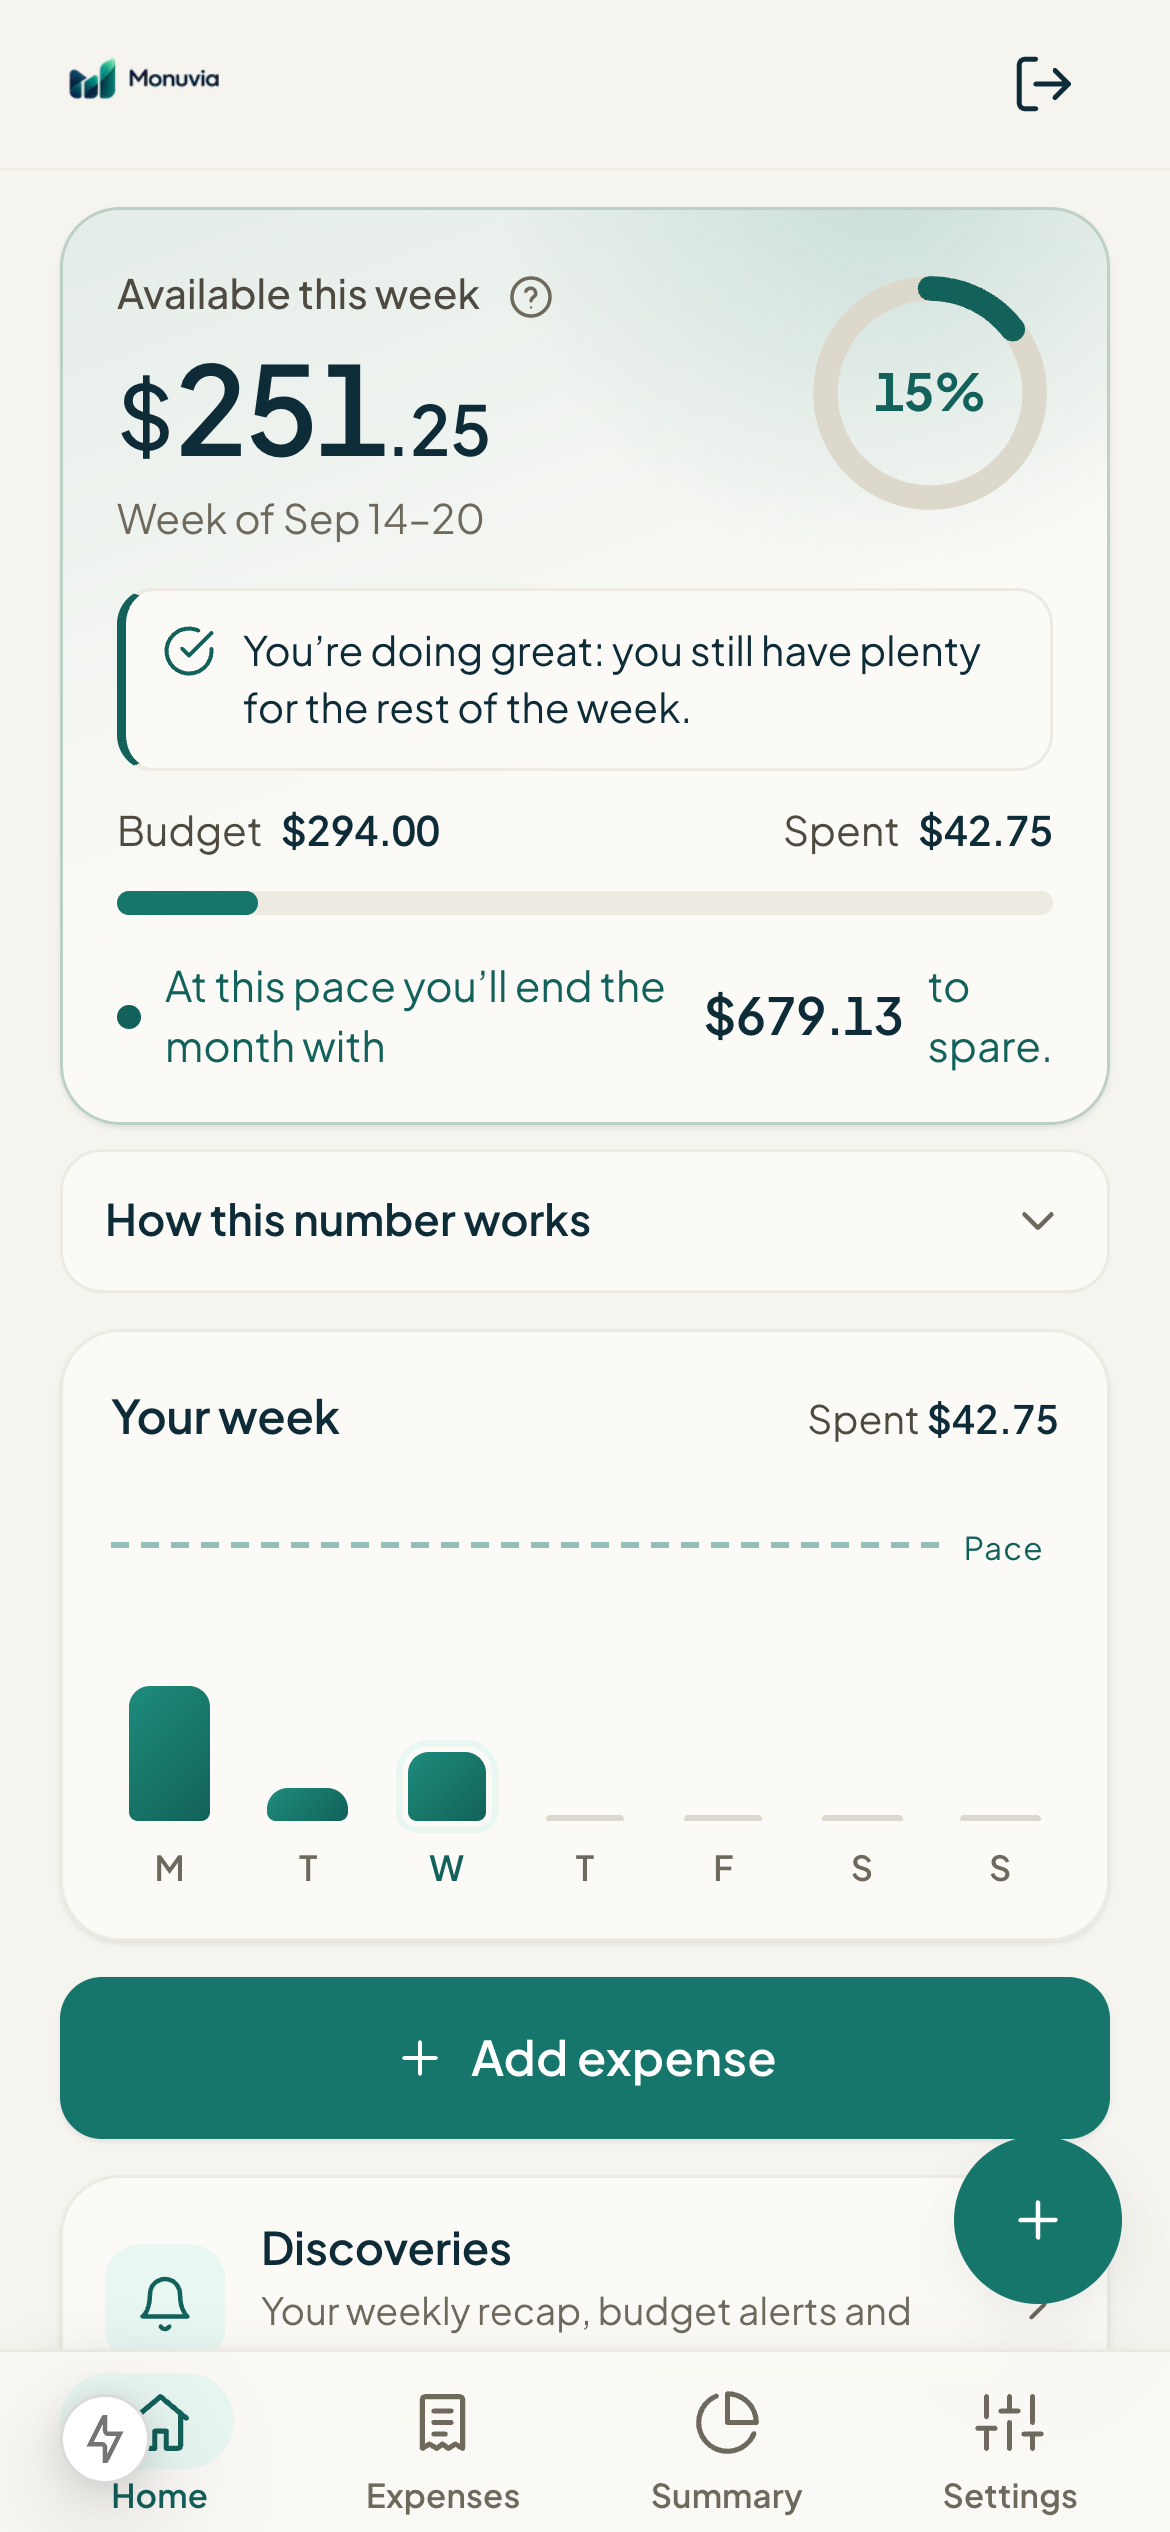
At the very top of your Home screen you'll see "Available this week" with a large figure. It's the most important number in Monuvia, so it's worth understanding exactly what it is — and what it isn't.
#How it's calculated
First, Monuvia works out your "free to spend" amount for the period (the month, or the fortnight if you use biweekly mode):
- Free to spend = income − bills − savings goal
- Week's budget = free to spend × days in that week ÷ days in the period
- Available this week = week's budget − what you've already spent this week
#The "How this number is calculated" breakdown
Right below the available amount is an expandable section called "How this number is calculated". Open it to see the full calculation, line by line, with your real figures.
- On the Home screen, tap "How this number is calculated".
- Read from top to bottom: "Income this month", "− Bills", "− Savings goal", and the total "= Free to spend".
- Next come "This week (X of Y days)", "− Spent this week", and the total "= Available".
- At the bottom you'll see "Left this month (free − everything spent)", which is what you have left for the rest of the period.
#Why the available amount changes
- You add an expense (by hand, by photo, or with Apple Pay / Google Pay): the available amount goes down.
- You enter or change your income, bills, or savings goal in Settings: your free-to-spend amount changes, and your budget along with it.
- A bill turns out different from expected (you mark it as paid for a different amount): everything recalculates.
- A new week begins: the available amount refills with that week's budget.
- A new month (or fortnight) begins: everything starts over.
#The Summary: donut chart, month, and year
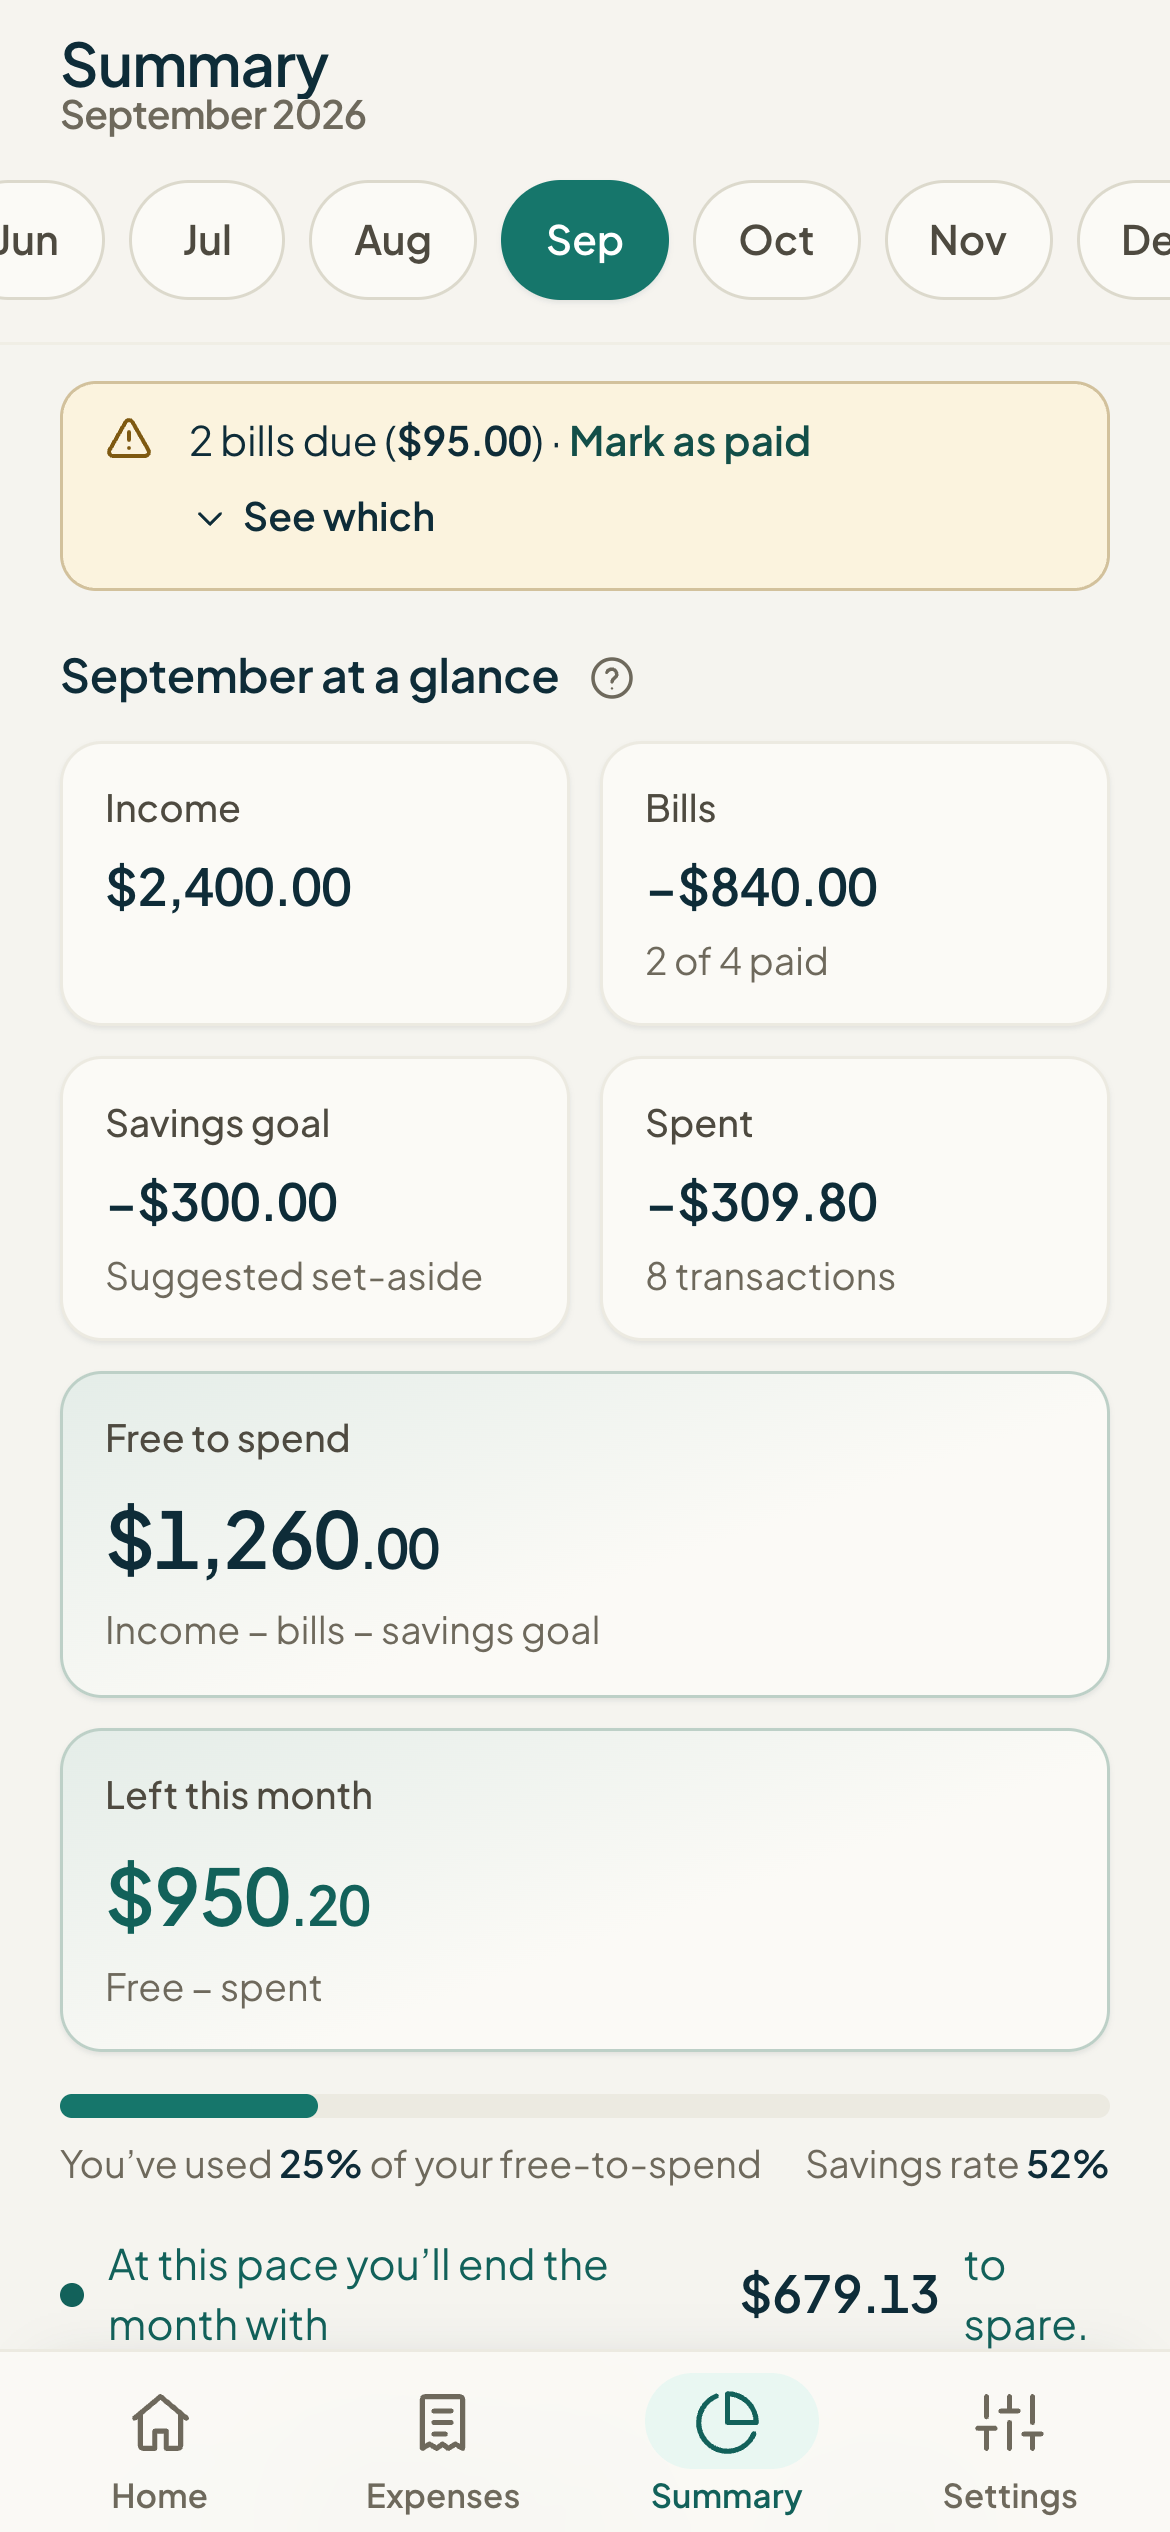
The Summary screen gives you the big picture for the month and the year. At the top, a row of months lets you move between them; tap the month you want to see.
- "Spending by category" donut chart: it breaks the selected month's spending down across your categories.
- "[month] at a glance": income, bills, savings goal, free to spend, spent, and what's left for the month.
- "Monthly limits": if you set a limit on a category, you'll see how much you've used against it.
- "[year] summary": a table with every month (income, spending, goal, and remaining).